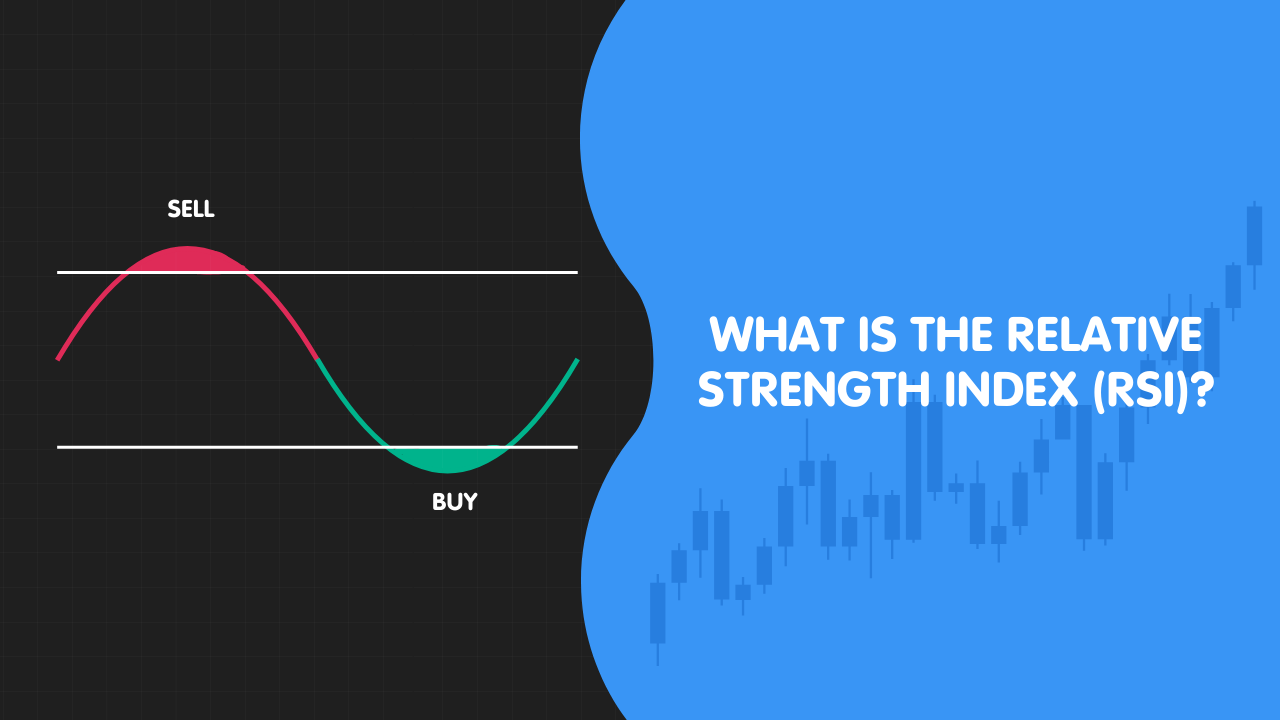
The Relative Strength Index (RSI) is a momentum oscillator used to measure the speed and change of price movements. In active trading, price rarely moves in a straight line; it fluctuates in waves. The RSI acts as a gauge to tell traders how much “fuel” is left in a specific move, helping them identify if a market is overextended or if a trend is losing its underlying strength.
Relative Strength Index (RSI) Indicator in Crypto Explained
In volatile markets, price action can often be deceptive. A sharp rally might look unstoppable on a price chart, but underneath the surface, the buying pressure could be drying up. The RSI exists to solve this visibility problem. By providing a mathematical snapshot of momentum, it allows traders to see whether a move is supported by genuine strength or is simply a result of exhausted market participants pushing price into an unsustainable “peak” or “trough.”
What is the Relative Strength Index (RSI)?
The RSI is a line that fluctuates between 0 and 100. It is called an “oscillator” because it moves back and forth within these fixed boundaries. The primary purpose of the RSI is to provide context to the current price. It asks: “Compared to the recent past, is the current move too fast or too far?”
When the RSI is high, it suggests that the gains are significantly outweighing the losses over the lookback period, suggesting a state of “overbought.” When it is low, the losses are dominating, suggesting the asset is “oversold.” For a trader, these aren’t just numbers; they are signals of potential exhaustion.
RSI in Crypto
Crypto markets are known for “vertical” moves where price moves 10% or 20% in a single day. In these conditions, traditional indicators often lag behind. The RSI is favored by crypto traders because it can highlight when a “moon” mission is losing steam or when a “dump” has hit a level of extreme exhaustion.
However, context is vital. On a newly launched asset with only a few days of trading history, the RSI lacks the data to establish a “normal” range. The indicator is most effective on established assets where the historical high and low momentum points are well-defined.
Calculating RSI
While modern charting software calculates this automatically, understanding the logic is key to using it effectively. The formula focuses on the ratio between the average gain and the average loss over a specific number of candles (the default is 14).
$RSI = 100 – \left[ \frac{100}{1 + \left( \frac{\text{Average Gain}}{\text{Average Loss}} \right)} \right]$
By looking at the last 14 periods, the RSI smooths out minor price wiggles to show you the true direction of momentum. If you shorten this lookback period, the RSI becomes more “jittery”; if you lengthen it, the line becomes smoother but reacts more slowly to price changes.
What is RSI used for in Crypto?
Traders use the RSI to validate what they see on the price chart. If the price is crashing, but the RSI is starting to turn upward, it suggests that the “selling power” is weakening even if the price hasn’t bounced yet. This provides a lead time that price alone cannot offer. It is primarily used to identify trend health, potential reversal points, and “divergences” where price and momentum disagree.
The 70-30 RSI range
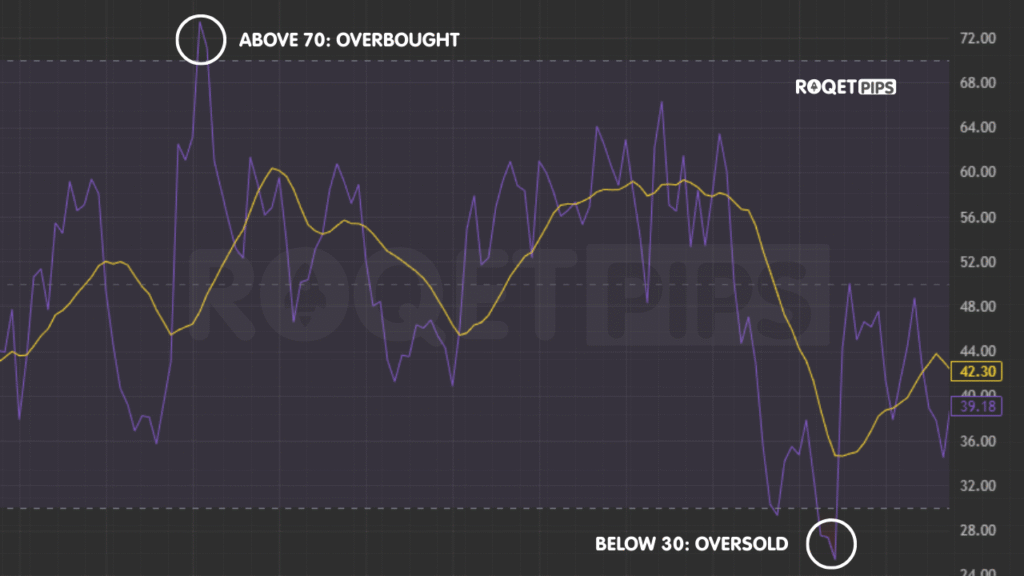
The standard benchmarks for RSI are the 70 and 30 levels.
- Above 70: The asset is considered “overbought.” This is an area where buyers might start taking profits, and new buyers should be cautious.
- Below 30: The asset is “oversold.” This is a zone where sellers might be exhausted, and buyers might begin looking for an entry.
Centerline Crossover
The 50-level is the “equator” of the RSI. It tells you who is in control of the market’s momentum.
- Crossing above 50: This suggests that bullish momentum is increasing. The “average gain” is starting to outpace the “average loss.”
- Crossing below 50: This suggests bearish momentum is taking over.
Traders often look for the 50-level crossover as a confirmation of a trend change. If price breaks a resistance level and the RSI simultaneously crosses above 50, it adds weight to the idea that the breakout is real.
RSI analysis
Just as price creates patterns like triangles or head-and-shoulders, the RSI line does the same. Traders often draw trendlines directly onto the RSI indicator. Frequently, an RSI trendline will break before the price trendline breaks, acting as an early warning system for a shift in market structure.
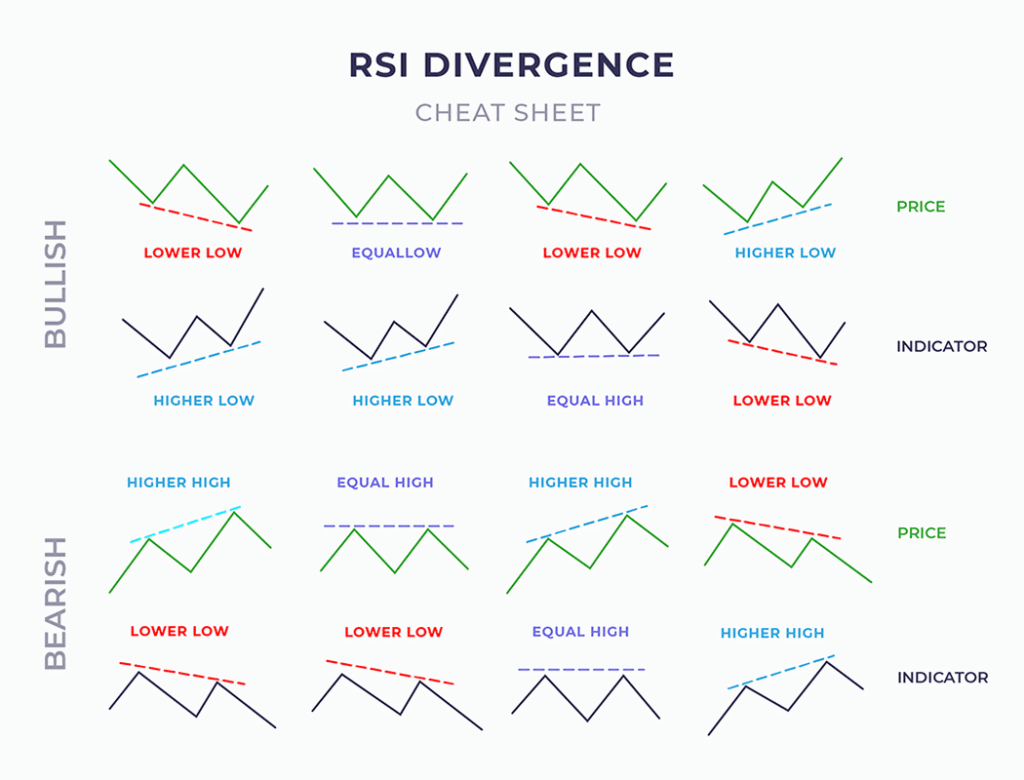
RSI Divergences
Divergence is perhaps the most powerful use of the RSI. It occurs when price action and the RSI line tell different stories.
- Bearish Divergence: Price makes a “Higher High,” but the RSI makes a “Lower High.” This is a warning that while the price is more expensive, the momentum behind it is actually failing.
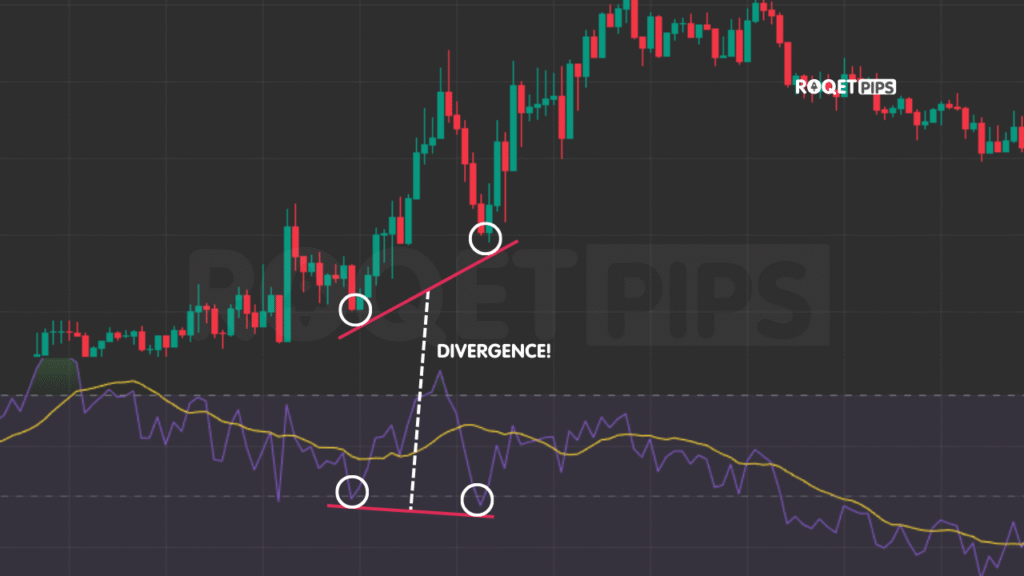
- Bullish Divergence: Price makes a “Lower Low,” but the RSI makes a “Higher Low.” This shows that while the price is dropping, the “selling pressure” is losing its intensity.
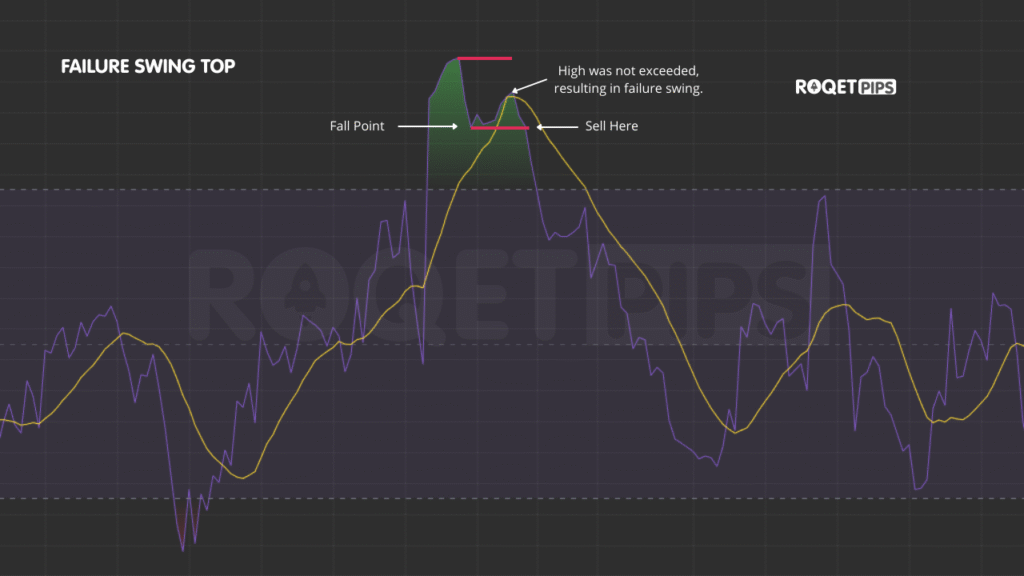
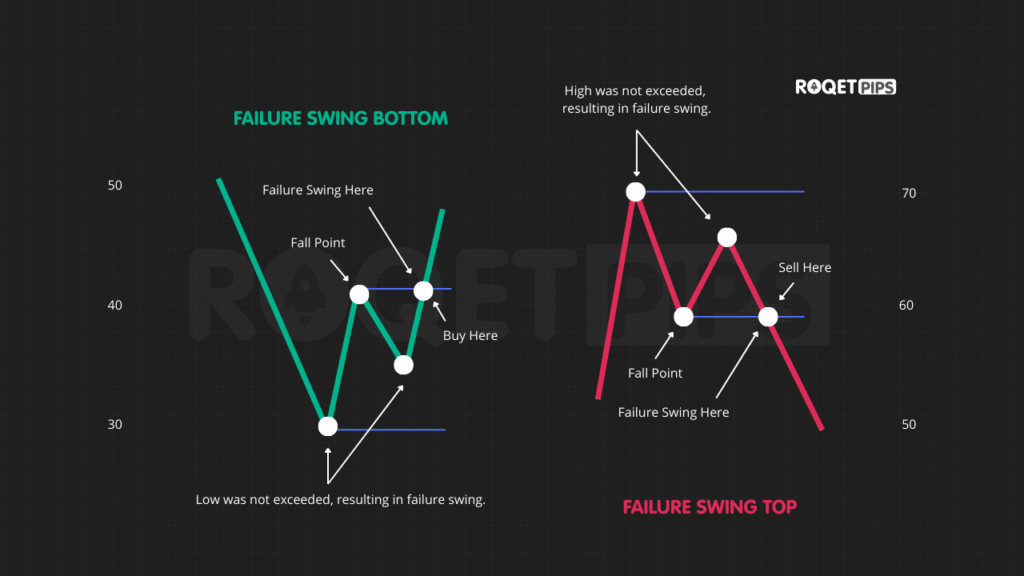
Failure swings
A failure swing is a specific type of reversal signal that ignores price and looks only at the RSI. It happens in two steps:
- The RSI reaches an extreme (above 70 or below 30).
- It pulls back, tries to return to that extreme, but “fails” to reach it and then breaks its previous local low (the “fail point”).
This is a sign that the momentum has peaked and the market is officially shifting direction. It is a “pure” momentum signal that doesn’t care about the noise on the price chart.
Trendline breaks
Traders often treat the RSI as its own chart. By drawing a trendline under the rising lows of the RSI (during an uptrend), they can spot a momentum breakdown. If the RSI line breaks its support trendline, it is a signal that the fuel for the current price move has run out, often leading to a price drop shortly after.
RSI Limitations
The biggest misunderstanding of the RSI is the “Overbought = Sell” trap. In a strong bull market, an asset can stay overbought (above 70) for weeks while the price continues to rise. Selling purely because the RSI is high can result in missing a massive move.
Similarly, in a “crash” scenario, the RSI can stay oversold (below 30) while price continues to plummet. The RSI shows speed and strength; it does not dictate when the market must turn. This is why traders use “confluence”—combining RSI with other tools like support levels or cloud indicators to confirm that a reversal is actually happening rather than just being “likely.”
Conclusion
The RSI is a window into the psychology of the market. It allows a trader to stop reacting to every price tick and start looking at the strength behind the moves. By watching for extremes, crossovers, and divergences, a trader can anticipate changes in the trend rather than simply following them.
FAQ
What is RSI in crypto?
The Relative Strength Index is a tool used to see if a cryptocurrency is currently being overvalued or undervalued based on the speed of its recent price changes. It helps identify when a price swing has gone too far.
What is RSI trading?
RSI trading involves using the indicator’s levels (30, 50, 70) and patterns (divergence) to decide when a trend is likely to continue or reverse. It is a way to trade based on momentum.
What is the best RSI setting for crypto?
The standard setting is 14 periods. While some traders use shorter periods (like 7 or 9) for faster signals, the 14-period setting remains the benchmark because it balances sensitivity with accuracy across most timeframes.
What is the RSI 70-30 strategy?
This is a basic method where traders look to sell when the RSI crosses back below 70 (leaving overbought territory) and look to buy when it crosses back above 30 (leaving oversold territory).
Is high RSI bullish or bearish?
A high RSI (above 70) is technically “overbought,” which can be bearish as it suggests a reversal is due. However, in a strong uptrend, a high RSI is actually bullish because it shows the buyers are in total control and moving the price with great strength.
Category: Market Structure
Tags: volatility, price movement, indicators, momentum, trend behavior, divergence, oscillators, technical analysis
Leave a Reply