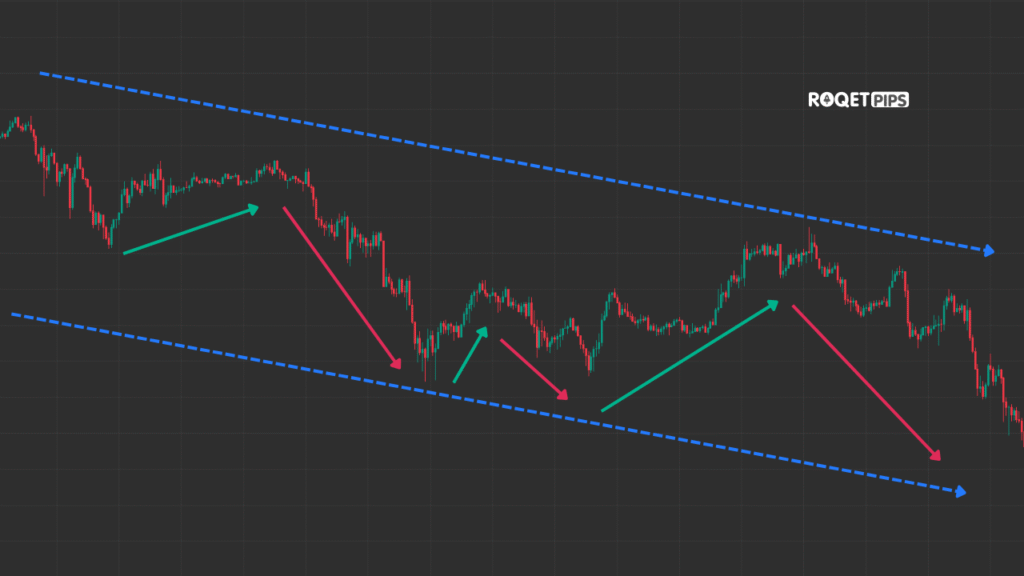
A bear market is a sustained period of declining prices, traditionally defined as a drop of 20% or more from recent highs. On a chart, this is not just a single “crash” but a structural shift where the previous upward momentum is replaced by lower highs and lower lows. It represents a phase where the market is dominated by supply, and buyers are either absent or unwilling to step in until prices reach significantly lower levels.
Why the name “bear”?
The “bear” moniker is deeply rooted in the mechanics of how market participants behave during a decline. One historical theory stems from the proverb about selling a bear’s skin before catching the bear, reflecting the practice of “short selling”—betting on a price drop.
A more visual explanation frequently cited by traders relates to the animal’s physical movement: a bear swipes downward with its paws. This provides a clear mental image of price action during these cycles. While a bull tosses prices upward with its horns, a bear crushes them back down toward the floor.
[ADS]
Famous bear markets in history
Historical cycles offer a blueprint for how price behaves when macro-economic structures fail. These events are characterized by a “thinning” of the order books and a rapid increase in volatility as liquidity disappears.
- The Great Depression (1929): This was the ultimate structural breakdown. After years of vertical price growth, the market reached a point of total exhaustion. When the collapse began, there were no buyers left to absorb the sell orders, leading to a multi-year trend of lower prices that took a decade to resolve.
- The Dot-com Bust (2000–2002): This cycle demonstrates what happens when price detaches from reality. Tech stocks moved into a “parabolic” state. When the momentum finally broke, the resulting bear market saw the index lose nearly 50% as the “hype” was reabsorbed into more realistic valuations.
- The Global Financial Crisis (2007–2009): Triggered by a housing bubble and the collapse of major financial institutions, this bear market was a “liquidity crisis.” On a chart, this looked like a series of failed rallies—every time the price tried to bounce, it was met with even heavier selling, eventually halving the value of the broader market.
[ADS]
Bear Markets in Crypto
In the digital asset space, bear markets are characterized by much higher velocity and deeper percentage drawdowns compared to traditional stocks. While a 20% drop is a bear market for stocks, crypto assets often experience 80% to 90% declines during their “winter” cycles.
These cycles are often triggered by a shift in “risk-on” sentiment. When global economic conditions tighten, capital flows out of volatile assets first. On a crypto chart, a bear market often begins with a “blow-off top”—a final, massive surge in volume and price—followed by a long, grinding descent where the asset loses its correlation with positive news.
Traders watch these periods for “capitulation”—a final wave of extreme selling where even the most dedicated holders give up. Historically, these moments of maximum “gloom” on the chart have marked the transition from a bear market into a new accumulation phase.
Category: Crypto Tags: price movement, trend behavior, volatility, liquidity, market cycles, drawdowns
Would you like me to rewrite a post about how to identify the start of an accumulation phase after a bear market bottom?
Leave a Reply