The Cup and Handle is a structural chart pattern that signals the continuation of an existing trend. It captures a specific market psychology: the transition from a period of high-velocity buying to a slow, rounded correction, followed by a final, tight consolidation before the trend resumes.
Traders use this pattern to solve the problem of “buying the top.” Instead of entering when the price is overextended, this pattern allows a trader to wait for the market to prove that it has the strength to absorb selling pressure at previous highs.
Key Takeaways
- The pattern represents a temporary pause in a broader uptrend, where the market “rests” and gathers liquidity before moving higher.
- It identifies a shift in market structure where resistance is systematically tested and eventually flipped into support.
- The “Handle” is the most critical part of the observation, as it represents the final shakeout of weak hands before a breakout.
What is the Cup and Handle Pattern?
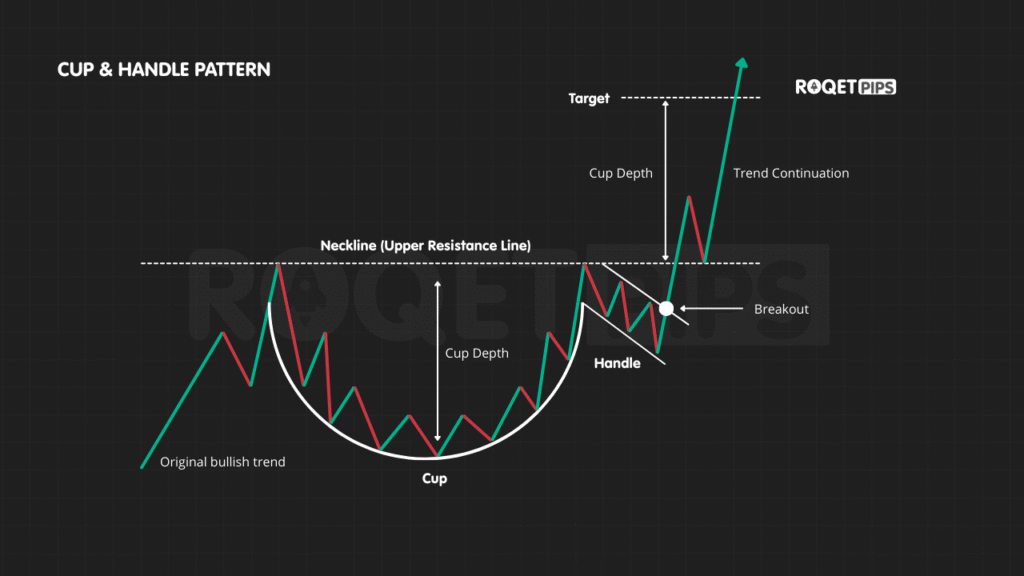
At its core, the Cup and Handle is a battle against a specific horizontal resistance level. After a strong rally, the price hits a peak and begins a gradual decline. This decline isn’t a sharp “V-shape” crash, but rather a smooth, “U-shaped” rounding bottom.
As the price recovers and returns to the previous peak, it hits a “ceiling” (resistance). Instead of breaking through immediately, the price pulls back slightly or moves sideways. This secondary, smaller dip is the “Handle.” On a chart, this looks like a cup with a smaller handle on the right side.
Traders look for this because it shows that sellers are becoming exhausted. Every time the price drops, buyers step in at higher levels than before, eventually squeezing the price against the resistance line until it breaks.
How to Identify a Cup and Handle Pattern
Identification starts with the preceding trend. You cannot have a continuation pattern without a strong trend to continue.
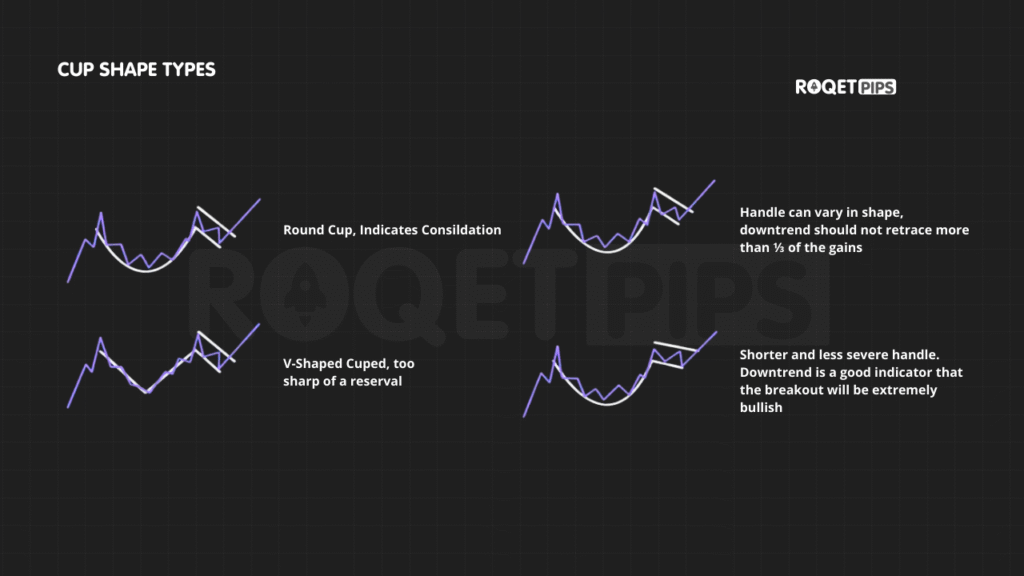
- The Cup: Look for a “U” shape, not a “V.” A “V” shape is too aggressive and suggests a volatile spike rather than a sustainable accumulation of buy orders. The bottom of the cup should be relatively smooth.
- The Depth: The cup should ideally retraces about one-third to one-half of the previous uptrend. If the cup is too deep (dropping 80-90%), the bullish momentum is likely dead, and the pattern is invalid.
- The Handle: This forms after the price reaches the lip of the cup. The handle should be a small, downward-sloping channel or a sideways consolidation. It should not drop more than 50% of the cup’s depth.
Crypto Cup and Handle Pattern Example
In the world of digital assets, these patterns often form over long periods (weeks or months). Because crypto is highly volatile, the “Cup” can sometimes look a bit more jagged than in traditional stocks, but the structural high points remain the same.
A classic example occurs when an asset reaches an all-time high, pulls back into a multi-month “winter,” and then slowly climbs back to that same high. The massive “Cup” shows the recovery, and the “Handle” shows the hesitation of traders who are afraid the price will reject the old high again.
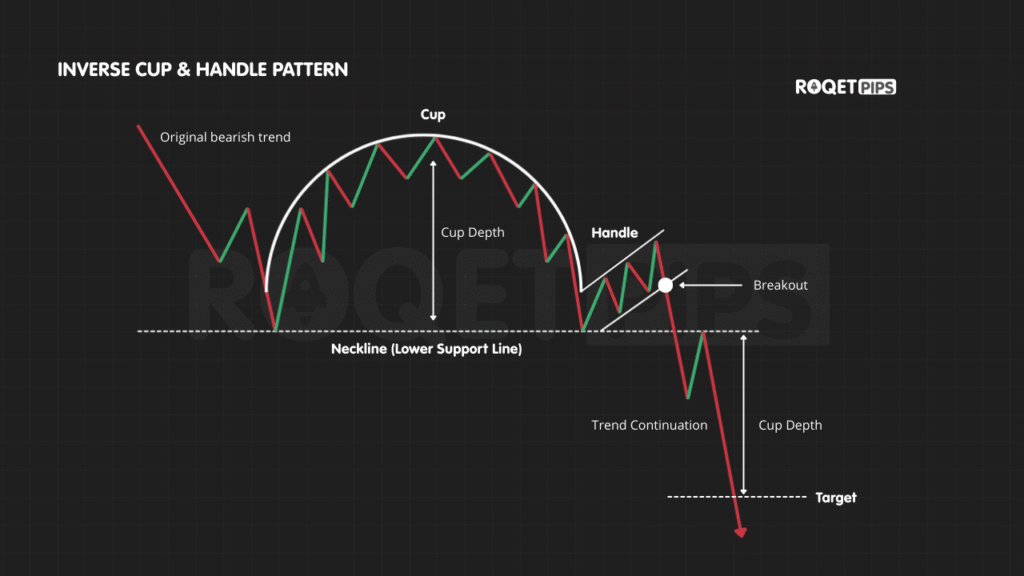
Inverse (Bearish) Cup and Handle Pattern
This is the mirror image of the bullish version and appears during downtrends. It signals that the selling pressure is likely to continue.
Instead of a “U” shape, you see a “Dome” (an upside-down cup). The price tries to bounce, but the bounces get weaker and weaker, forming an upside-down handle. When the “floor” (support) finally breaks, the price usually drops rapidly as the last buyers give up.
How to Trade the Cup and Handle
Observation is only half the task; the entry is where traders often fail. Many jump in as soon as they see a “U” shape, but the pattern is only confirmed when the handle breaks.
Traders usually watch the upper trendline of the handle. When the price breaks above this line with an increase in volume, it signals that the consolidation is over. Another common method is to wait for the price to clear the horizontal resistance line (the “lip” of the cup) and then look for a “retest”—where the price comes back to touch that line before bouncing higher.
Advantages of the Cup and Handle Pattern
The main advantage is the clear “risk-off” level. If you enter on the breakout of the handle, your “invalidations” point is very clear: if the price falls back below the bottom of the handle, the pattern has failed.
This provides a high reward-to-risk ratio. Because the pattern usually follows a long period of consolidation, the resulting breakout can be explosive as “buy-stop” orders above the resistance are triggered simultaneously.
Limitations of the Cup and Handle Pattern
The biggest misunderstanding is ignoring the broader market context. If the overall market is in a deep bear trend, a “Cup and Handle” on a 15-minute chart is likely to fail.
Patterns can also turn into “bull traps.” Sometimes the price breaks out of the handle, attracts buyers, and then immediately crashes back into the cup. This is why many practitioners use volume as a filter—a true breakout should be accompanied by a noticeable spike in trading activity. Without volume, the “breakout” is often just a fake-out.
Conclusion
The Cup and Handle is a visual map of market indecision turning into conviction. While it is highly recognizable, its success depends on the “Handle” remaining tight and the breakout happening on significant volume. It is a tool for patience, requiring the trader to wait for the market to prove its intent before stepping in.
FAQ
Is a cup and handle bullish? Yes, it is traditionally a bullish continuation pattern. It suggests that after a period of profit-taking (the cup) and a minor shakeout (the handle), the previous uptrend is ready to resume.
What is the cup and handle method? It is a systematic way of identifying entry points by drawing a resistance line across the peaks of a “U” shaped consolidation and entering when price breaks the subsequent “handle” or retests the resistance as support.
How reliable is the cup and handle pattern? Like all technical patterns, it is not 100% certain. Reliability increases on higher timeframes (like Daily or Weekly charts) and when confirmed by other factors like increasing volume or bullish momentum indicators.
Category: Market Structure Tags: chart patterns, continuation, price action, resistance, breakout, consolidation, market cycles
Leave a Reply