The bull and bear flags are continuation patterns that represent a brief pause in a high-momentum move. In the fast-moving environment of a trending market, price rarely moves in a single vertical line without stopping. Instead, it moves in “bursts.” A flag pattern captures the moment where the market takes a breath, allowing supply and demand to rebalance before the previous aggressive trend resumes.
The Definition of a Flag Pattern
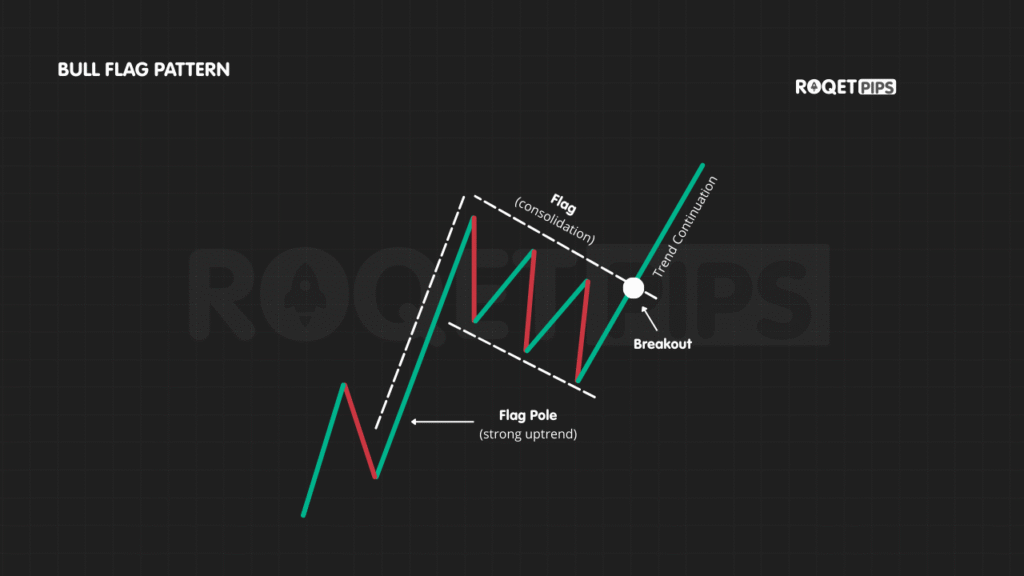
A flag pattern is a visual representation of a “breather” after a violent price expansion. It consists of two distinct phases. First, there is a sharp, nearly vertical move—known as the flagpole—where one side of the market (buyers or sellers) is in total control. This is followed by a narrow, sloping consolidation period—the flag—where price moves in a tight channel against the direction of the main trend.
Traders look for this because it solves a major problem: FOMO (Fear Of Missing Out). Instead of chasing a vertical move that is already overextended, a trader waits for the “flag” to form. This allows them to enter at a more stable price level while the market prepares for its next leg in the original direction.
Anatomy of a Flag Pattern
To recognize this on a live chart, you must look for four specific components that tell the story of the trend’s health:
- Flagpole: This is the “impulse” move. It should be steep and high-volume, representing a clear consensus among market participants.
- Flag: A series of small candles moving in a tight, parallel channel. This is the consolidation phase. It should look like a controlled pullback, not a chaotic reversal.
- Breakout Point: The specific moment when price closes outside the flag’s parallel trendlines in the direction of the flagpole.
- Continuation: The secondary move that mirrors the intensity of the initial flagpole.
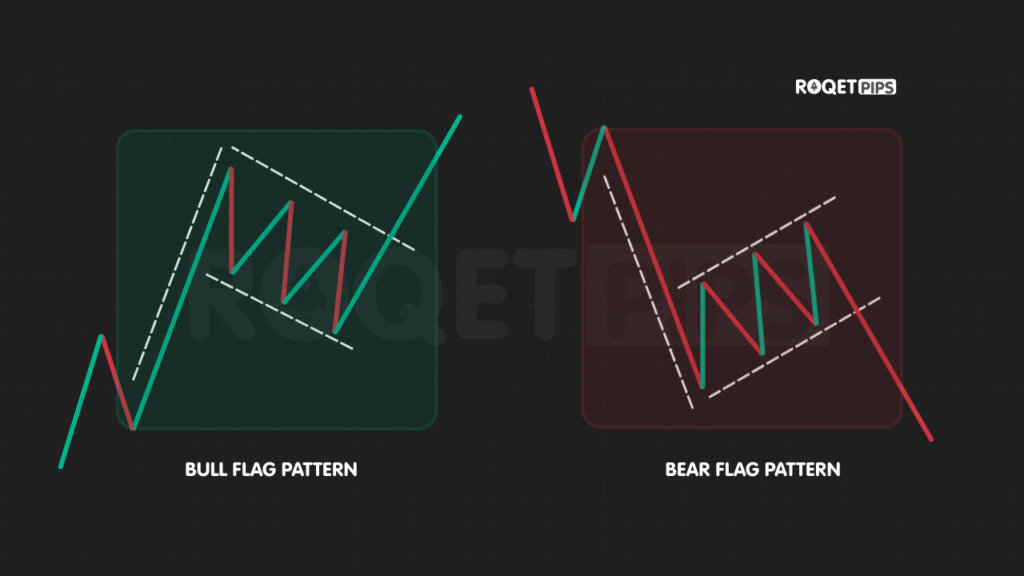
What Is a Bull Flag Pattern?
A bull flag appears during an uptrend. After a strong surge upward, some traders begin to take profits, which causes a slight, orderly decline. However, because the underlying demand is still high, the price doesn’t collapse; it simply drifts downward in a narrow channel.
When you see this on a chart, it indicates that buyers are still waiting on the sidelines to get in. As soon as the price breaks above the upper boundary of the flag, it often triggers a “short squeeze” or a fresh wave of buying, propelling the price toward new highs.
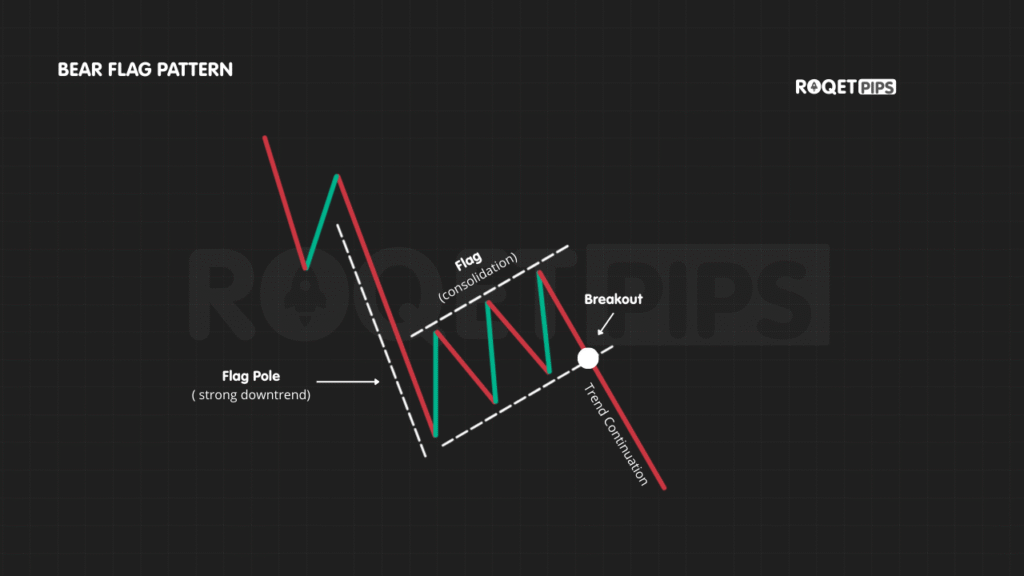
What Is a Bear Flag Pattern?
A bear flag is the inverse. It starts with a sharp, panic-driven drop (the flagpole). After the initial crash, the price begins to “flag” upward in a weak, ascending channel. This upward drift is often deceptive; it isn’t caused by strong buying, but rather by a temporary lack of aggressive selling.
Experienced traders view this upward drift as an opportunity to “sell the rip.” Once the price breaks below the lower support line of the bear flag, the downward momentum usually returns with similar force to the original drop.
How to Trade Flag patterns?
The key to utilizing flags is patience. A common mistake is entering inside the flag while the price is still consolidating. Because the flag is a “counter-trend” move, the price can stay within that channel longer than expected.
Professional observation focuses on the breakout candle. A high-quality signal usually involves a candle closing outside the flag boundary on increased volume. This volume spike confirms that the “breather” is over and the market is ready to resume the primary trend.
How to Trade Bull Flag Patterns?
When observing a bull flag, the focus is on the upper resistance line. A breakout above this line suggests that the profit-taking is over and buyers have regained control.
Traders often project the height of the original flagpole starting from the breakout point to estimate where the next move might stall. To manage risk, a common practice is to look for price to hold above the flag’s lower support. If price falls back into the flag or through the bottom, the pattern is considered “broken” or invalidated.
How to Trade Bear Flag Patterns?
Trading a bear flag involves watching the lower support line of the ascending channel. The entry point is typically identified when price breaks and closes below this support.
Because bear flags are often driven by panic and liquidations, the continuation move can happen very quickly. Risk is managed by observing the upper resistance of the flag; if price pushes above the flag, it suggests the sellers have lost their grip and the bearish thesis is no longer valid.
Flag vs. Pennant
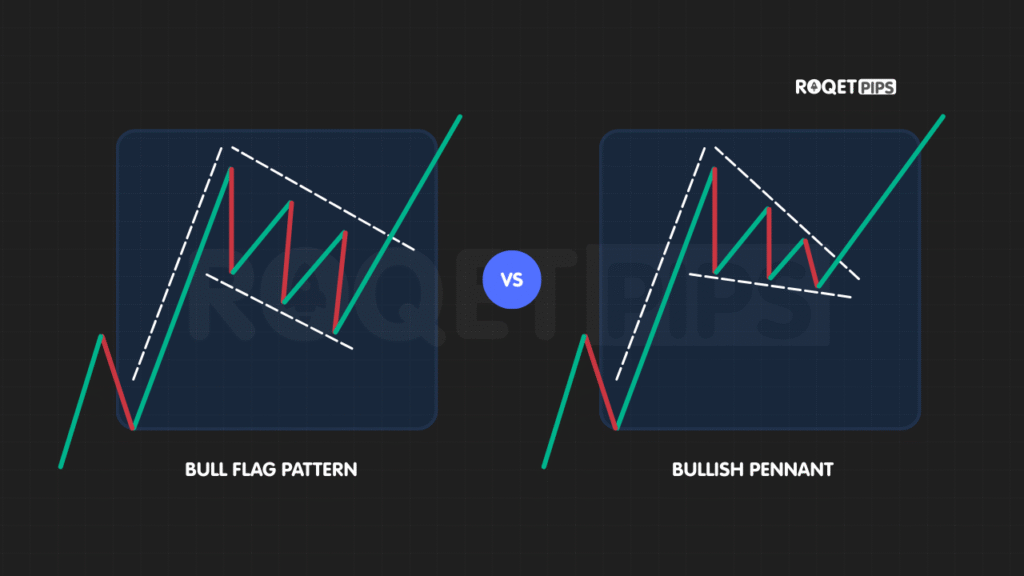
Flags and pennants serve the same purpose—identifying continuation—but they look different during the consolidation phase.
- Flag: The consolidation happens between two parallel lines (a channel). It looks like a rectangle tilted against the trend.
- Pennant: The consolidation happens between two converging lines (a small triangle). The highs get lower and the lows get higher until the price is squeezed into a point before the breakout.
How to Combine Bull and Bear Flags with Other Indicators
No pattern should be viewed in a vacuum. Using indicators can help filter out “fakeouts”—moments where price briefly exits the flag only to reverse.
Volume: This is the most critical confirmation. The flagpole should have high volume, the flag itself should have declining volume (less participation), and the breakout should see a fresh surge in volume.
RSI (Relative Strength Index): During a bull flag, the RSI will often pull back from “overbought” levels (above 70) toward the midline (50). This “cooling off” of the RSI while price stays relatively high is a sign of extreme trend strength. Conversely, in a bear flag, a “cooling off” of an oversold RSI (rising toward 50) while price stays low suggests that the next leg down will be powerful.
Category: Market Structure
Tags: price movement, trend behavior, continuation patterns, volatility, breakouts, volume, consolidation
Leave a Reply