A candlestick chart is more than a record of price; it is a visual map of a struggle between buyers and sellers. While the “body” of a candle shows where the market eventually agreed to close, the “wicks”—those thin lines extending above and below—tell the story of where the market went but could not stay. Long wicks are significant because they reveal areas of price rejection.
What this is
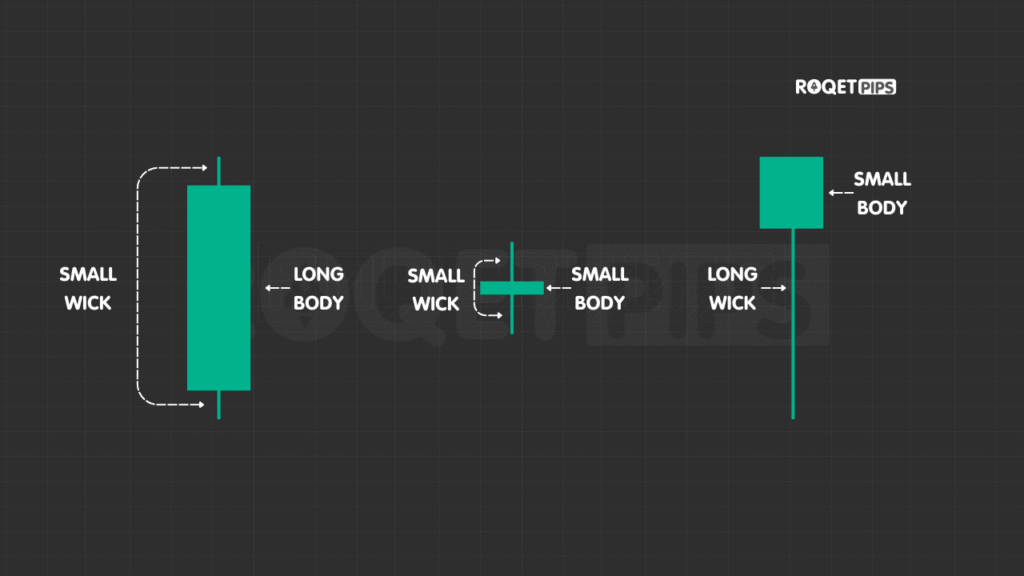
A “wick” (or shadow) represents the price range explored during a specific time period that the market ultimately moved away from before the candle closed. A long wick indicates a sharp reversal of sentiment within a single candle.
- Long Upper Wick: Price pushed significantly higher, but sellers stepped in and forced the price back down toward the opening level.
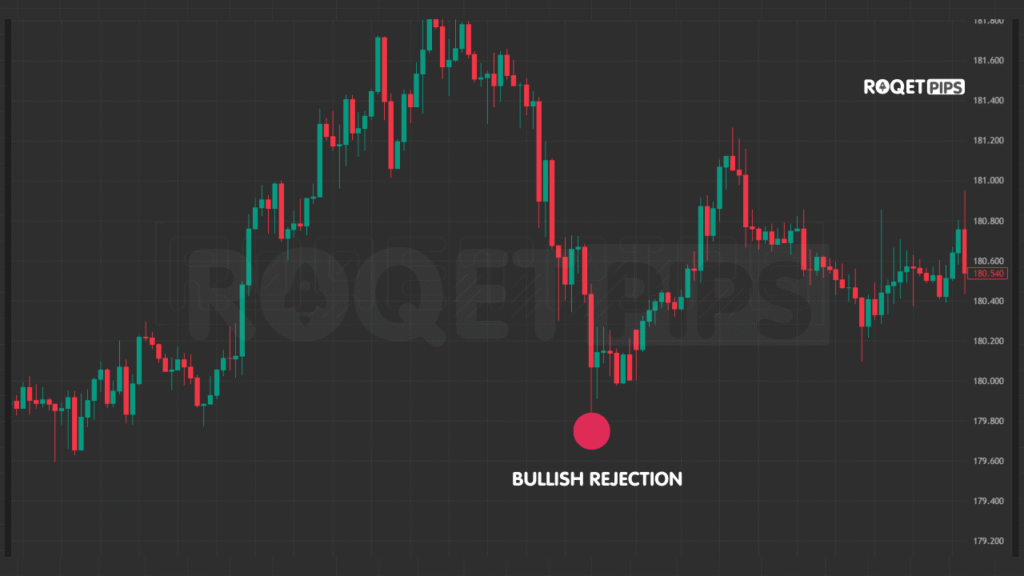
- Long Lower Wick: Price dropped sharply, but buyers stepped in and drove the price back up toward the opening level.
Traders categorize these based on where the body sits. A Hammer has a long lower wick with the body at the top, suggesting a rejection of lower prices. A Shooting Star has a long upper wick with the body at the bottom, suggesting a rejection of higher prices. A Spinning Top has long wicks on both sides, indicating a high-volume tug-of-war where neither side gained ground.
Why traders pay attention to it
Traders look for long wicks because they represent “failed” momentum. When a price move is healthy, candles tend to have full bodies with short wicks, showing that the market is comfortably moving in one direction.
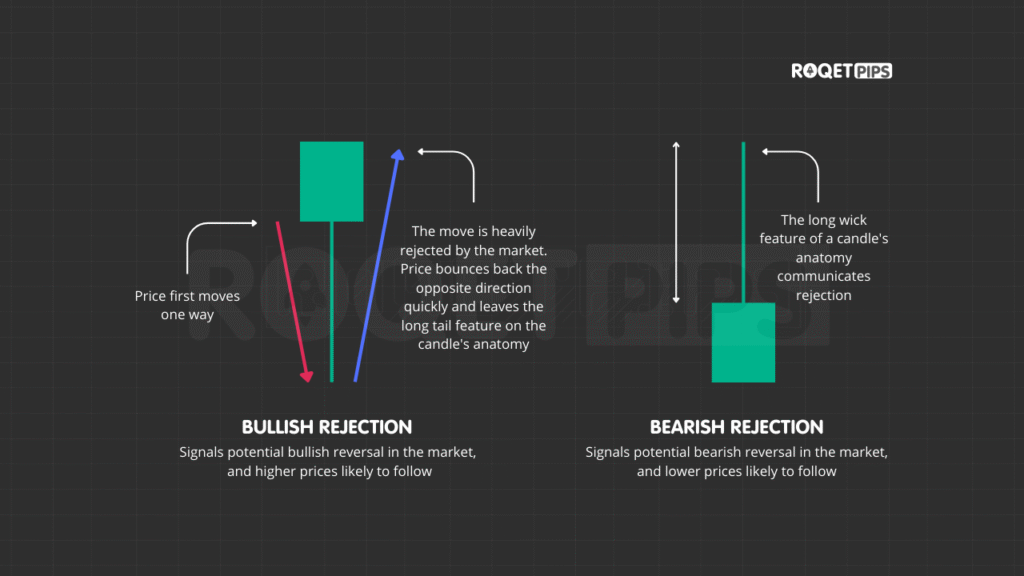
A long wick is a visual signal that the market has hit a wall. It shows that at a certain price level, the opposite force (supply or demand) became so strong that it completely overwhelmed the current trend. For anyone looking at a chart, a long wick is a warning sign that the current path of least resistance has been blocked.
What it tends to show on a chart
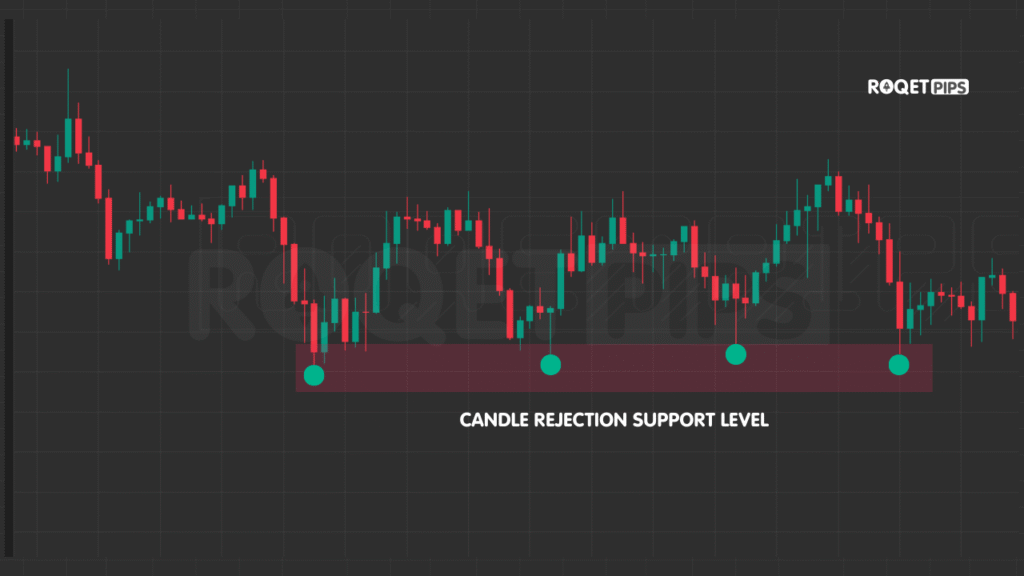
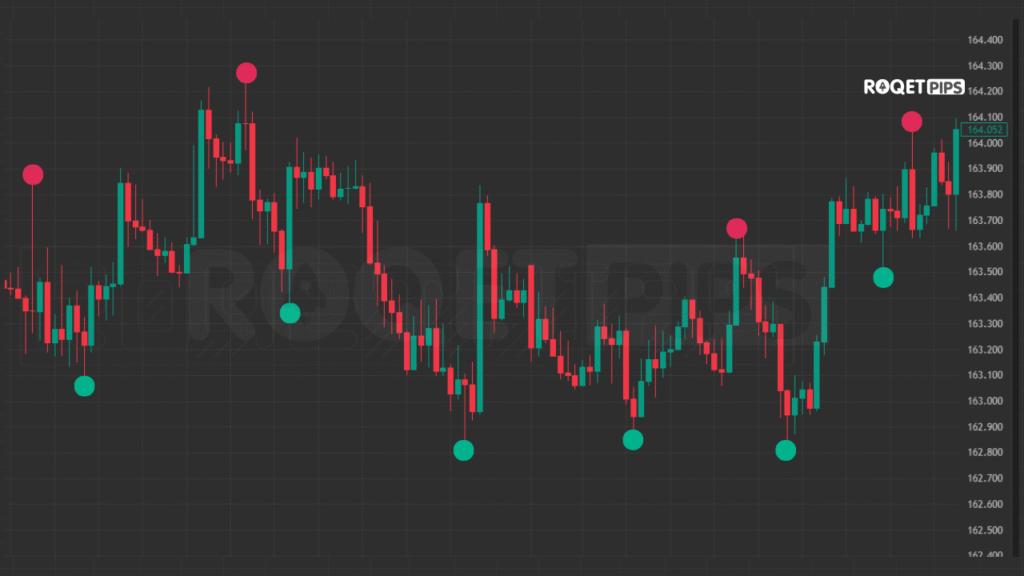
On a chart, long wicks often cluster around key levels. They act as “scouts” that probe a price area only to get pushed back.
In an uptrend, you might see several candles in a row with long upper wicks hitting the exact same horizontal level. This tells you that despite the overall bullish trend, there is a “ceiling” where sellers are waiting to dump their positions. Conversely, in a downtrend, long lower wicks hitting the same bottom level show a “floor” where buyers are aggressively stepping in.
How traders usually apply it
Practical chart reading requires looking at the “fill.” Sometimes, after a long wick forms, subsequent candles will slowly move back into that wick’s territory. This is called “filling the wick.”
- If the market fills the wick and stays there, the rejection was temporary, and the trend might continue.
- If the market stays away from the wick and moves in the opposite direction, the rejection is confirmed as a trend reversal.
Traders also use the extreme end of a long wick as a marker for a “Stop Loss.” Since the market has already proven it couldn’t stay beyond that point, any move that eventually breaks past the tip of the wick suggests the entire rejection thesis has failed.
[ADS]
Where it often gets misused or misunderstood
The biggest mistake is treating a long wick as an immediate “reversal signal” without context. A long wick in the middle of a sideways, choppy market is often just “noise”—normal volatility that doesn’t mean much. To be meaningful, a long wick needs to occur after a clear trend or at a major historical price level.
Another misunderstanding is the “Bull Trap” or “Bear Trap.” Sometimes, a long wick is created by large participants intentionally pushing price into a zone where they know many people have placed orders, only to reverse it immediately.
[ADS]
Finally, traders often forget to check the volume. A long wick on low volume is much less significant than a long wick on high volume. High volume on a long wick confirms that a large number of market participants participated in the rejection, making that price level much more important for future chart reading.
Category: Market Structure
Tags: volatility, price movement, trading ranges, trend behavior, indicators, candlesticks
Leave a Reply