Tag: trading ranges

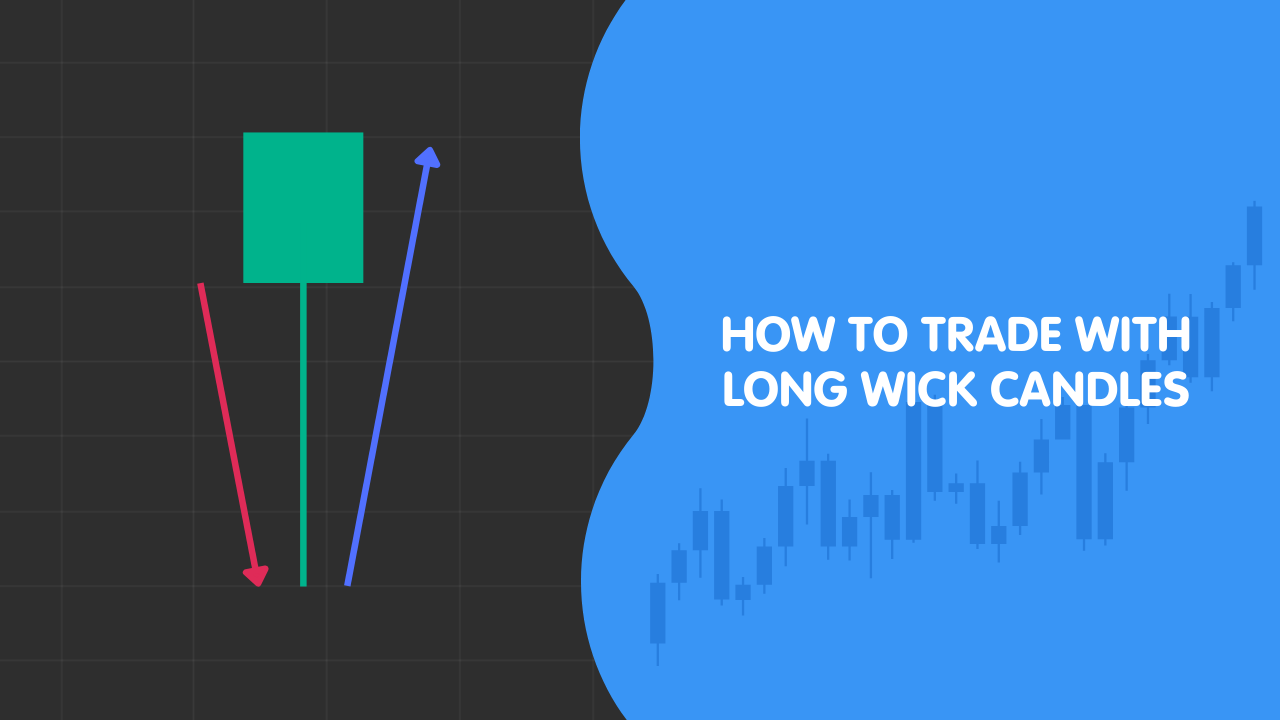
How to Trade with Long Wick Candles
A candlestick chart is more than a record of price; it is a visual map of a struggle between buyers and sellers. While the “body” of a candle shows where the market eventually agreed to close, the “wicks”—those thin lines extending above and below—tell the story of where the market went but could not stay.…

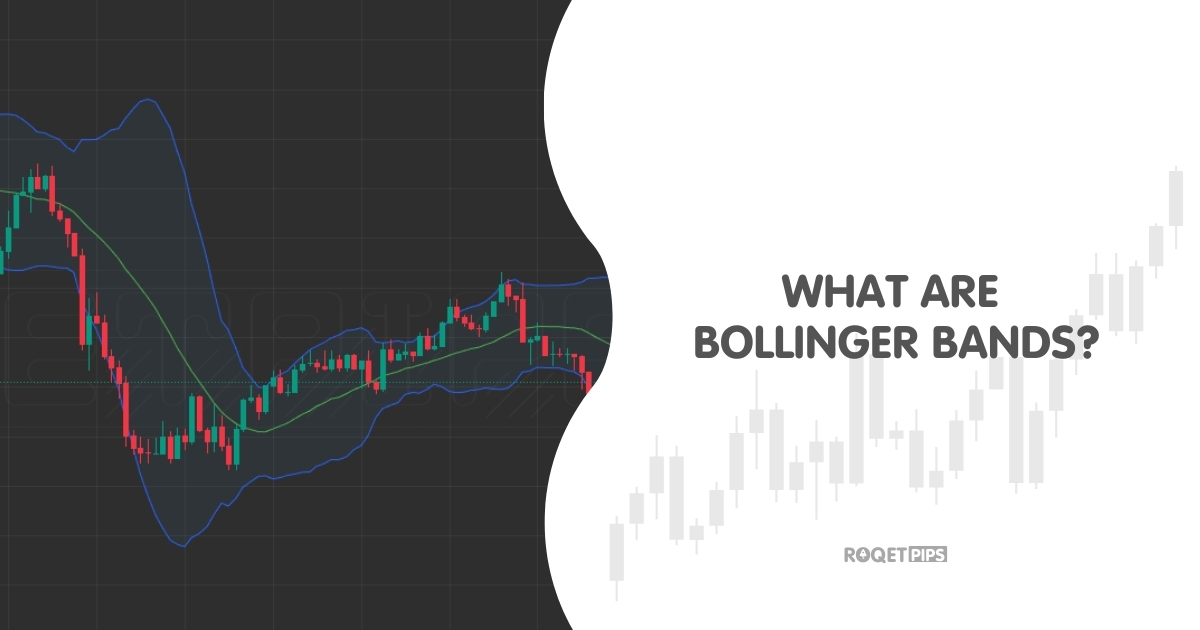
What are Bollinger Bands?
Bollinger Bands are a technical charting tool designed to map the relationship between price and volatility. In a live market, price does not move in a straight line; it breathes, expanding during periods of high activity and contracting during periods of rest. This indicator provides a visual “envelope” that quantifies that breathing room using statistical…