Tag: trend behavior

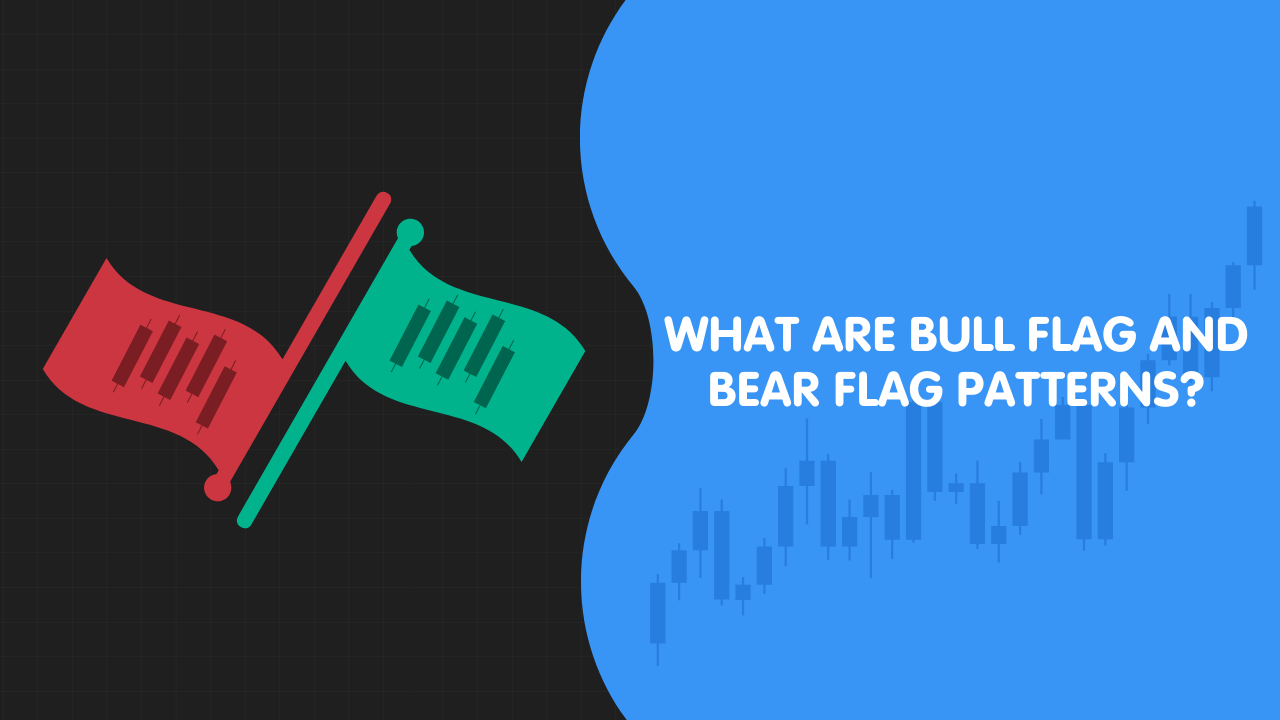
What Are Bull Flag and Bear Flag Patterns?
The bull and bear flags are continuation patterns that represent a brief pause in a high-momentum move. In the fast-moving environment of a trending market, price rarely moves in a single vertical line without stopping. Instead, it moves in “bursts.” A flag pattern captures the moment where the market takes a breath, allowing supply and…
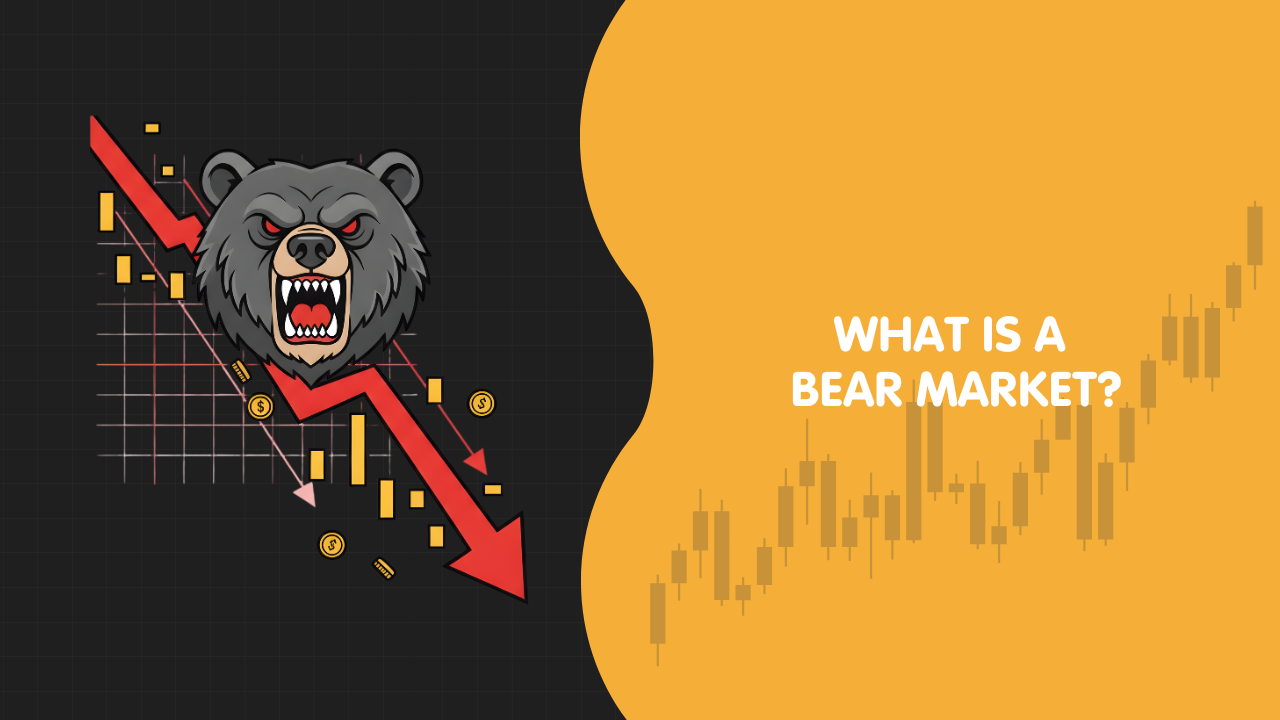
What Is a Bear Market?
A bear market is a sustained period of declining prices, traditionally defined as a drop of 20% or more from recent highs. On a chart, this is not just a single “crash” but a structural shift where the previous upward momentum is replaced by lower highs and lower lows. It represents a phase where the…
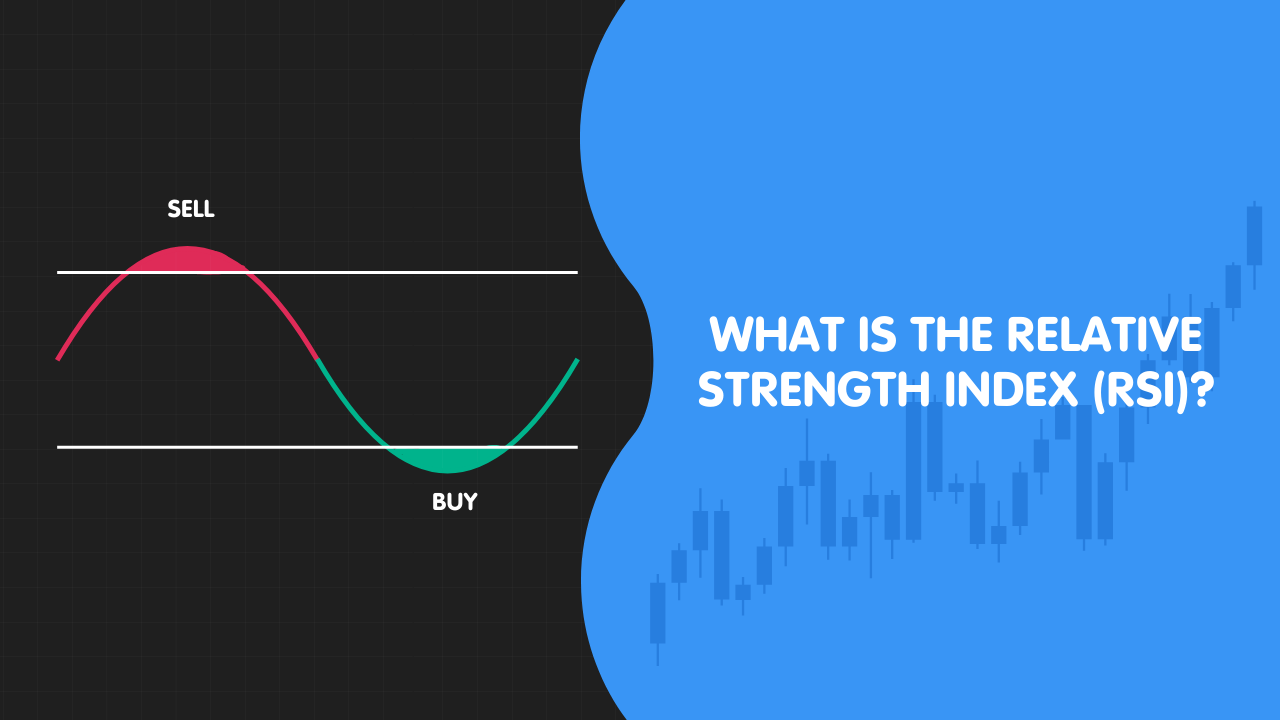
What is the Relative Strength Index (RSI)?
The Relative Strength Index (RSI) is a momentum oscillator used to measure the speed and change of price movements. In active trading, price rarely moves in a straight line; it fluctuates in waves. The RSI acts as a gauge to tell traders how much “fuel” is left in a specific move, helping them identify if…
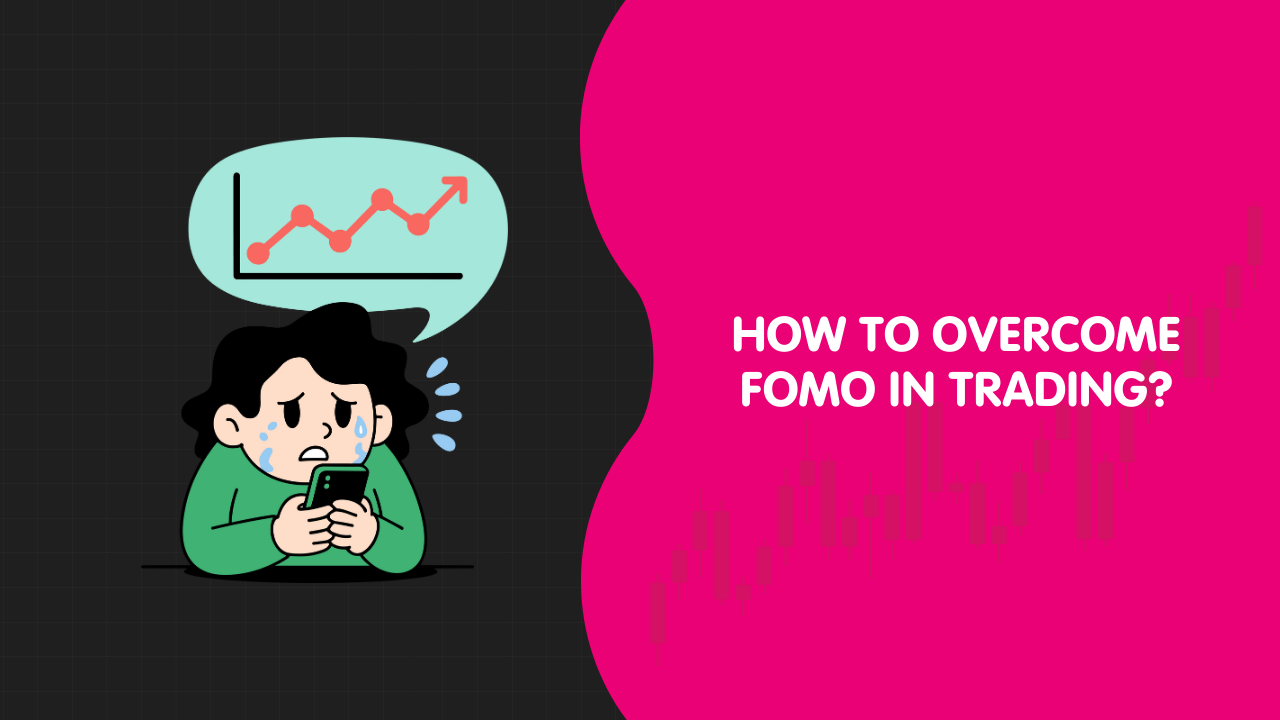
How To Overcome FOMO in Trading?
FOMO, or the “fear of missing out,” is a psychological state where a trader feels an overwhelming urge to enter a position based on the movement of others rather than their own technical criteria. In the high-velocity environment of financial markets, this often manifests as buying an asset after a significant price surge or selling…
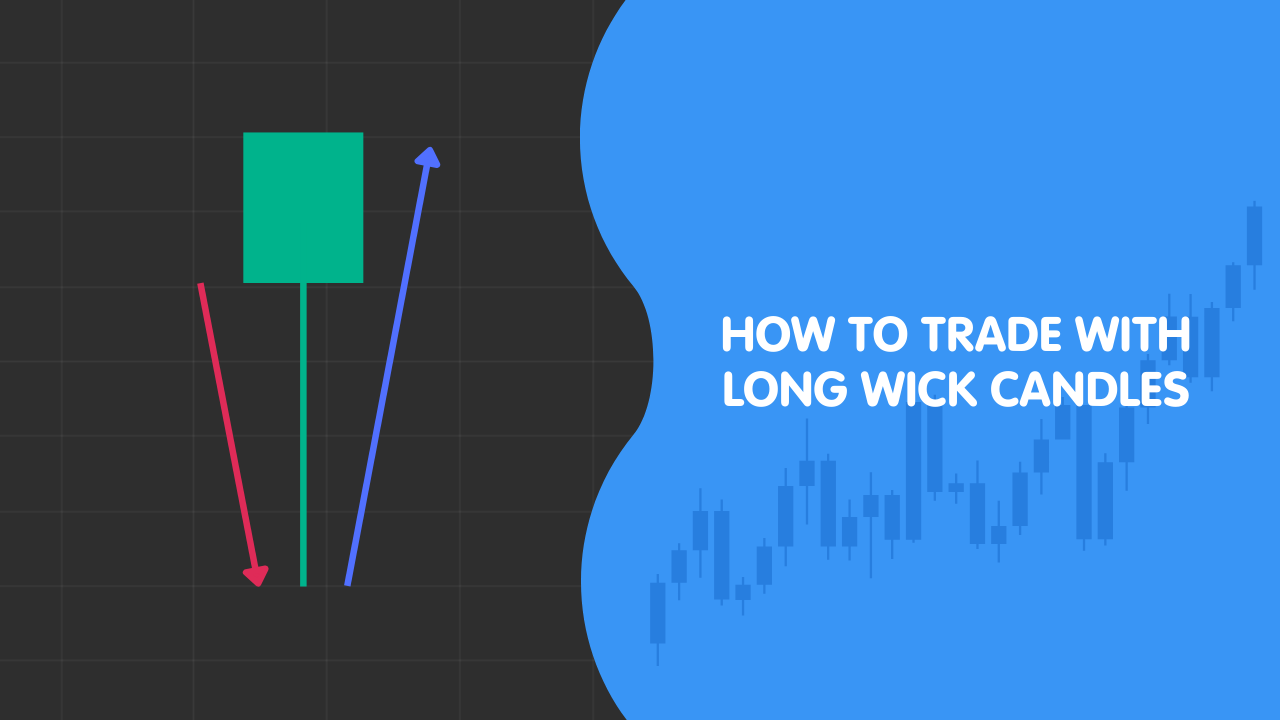
How to Trade with Long Wick Candles
A candlestick chart is more than a record of price; it is a visual map of a struggle between buyers and sellers. While the “body” of a candle shows where the market eventually agreed to close, the “wicks”—those thin lines extending above and below—tell the story of where the market went but could not stay.…

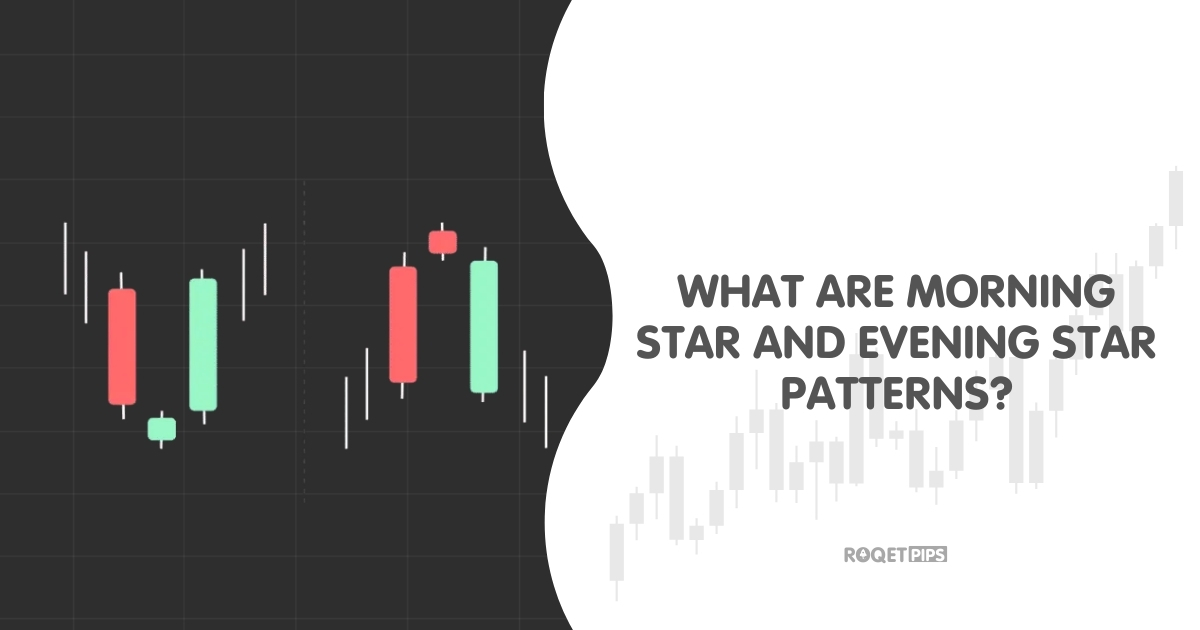
What are Morning Star and Evening Star Patterns?
Candlestick patterns are visual representations of shifts in market psychology. While most individual candles represent a continuation of current sentiment, specific multi-candle clusters suggest that the dominant force in the market—whether buyers or sellers—is losing its grip. The Morning Star and Evening Star are two of the most recognizable three-candle clusters used to identify these…
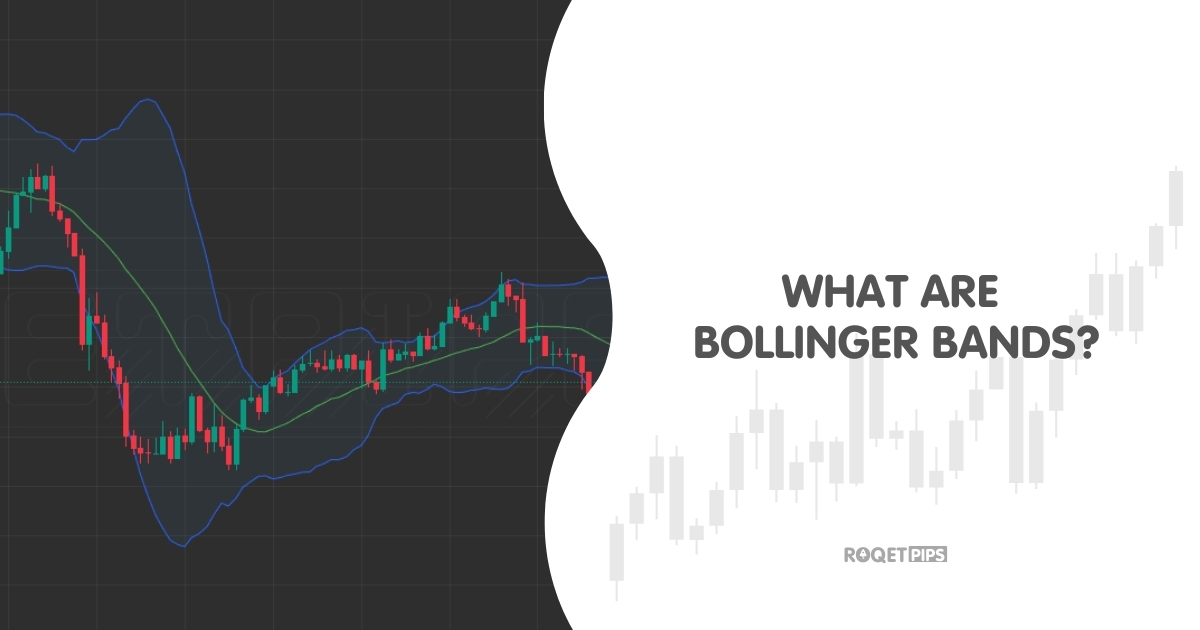
What are Bollinger Bands?
Bollinger Bands are a technical charting tool designed to map the relationship between price and volatility. In a live market, price does not move in a straight line; it breathes, expanding during periods of high activity and contracting during periods of rest. This indicator provides a visual “envelope” that quantifies that breathing room using statistical…