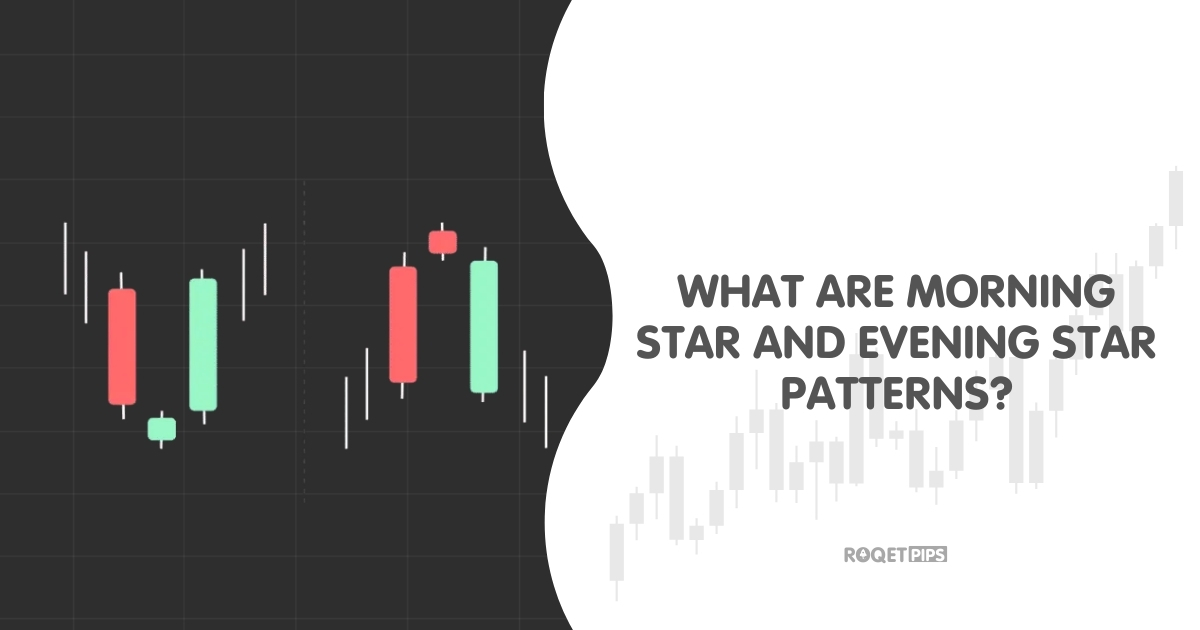
Candlestick patterns are visual representations of shifts in market psychology. While most individual candles represent a continuation of current sentiment, specific multi-candle clusters suggest that the dominant force in the market—whether buyers or sellers—is losing its grip. The Morning Star and Evening Star are two of the most recognizable three-candle clusters used to identify these potential turning points.
What this is
These patterns are “reversal” clusters. They don’t just show price moving; they show a three-act transition from one side being in total control to a state of equilibrium, and finally to the opposite side taking over.
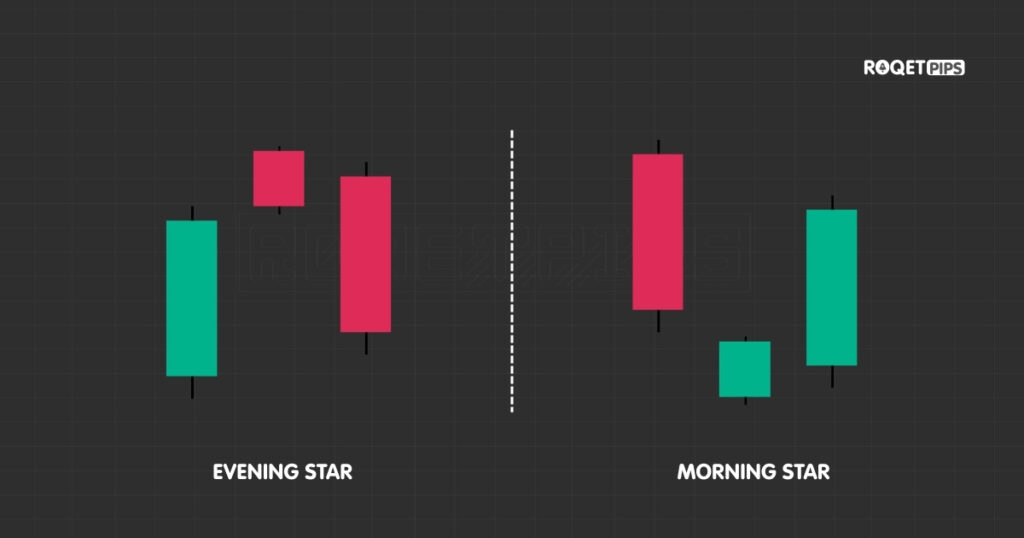
- The Morning Star: A bullish reversal found after a price decline. It suggests the “darkness” of the downtrend is ending.
- The Evening Star: A bearish reversal found after a price rally. It suggests the “daylight” of the uptrend is fading.
Because these patterns require three distinct candles to complete, they provide more information than single-candle signals. They require confirmation before the pattern is considered valid, which helps filter out some of the “noise” found on lower-timeframe charts.
Why traders pay attention to it
Traders look for these stars because they highlight “exhaustion.” Markets rarely flip from a vertical move in one direction to a vertical move in the other without a moment of hesitation.
The “Star” (the middle candle) represents that hesitation. It is a moment where the aggressive selling or buying of the first candle fails to continue. For a trader, this is a signal to stop expecting the current trend to continue blindly and to start looking for signs that the opposite side is stepping in.
[ADS]
What it tends to show on a chart
To recognize these on a chart, you have to look for a specific sequence of three events:
- The Dominant Move: A large candle that matches the current trend (red for Morning Star, green for Evening Star). This shows the trend is at its most confident.
- The Indecision (The Star): A small-bodied candle. It doesn’t matter much if it is green or red; what matters is that the body is small, often with wicks on both sides. This shows the tug-of-war is even.
- The Shift in Power: A large candle moving in the opposite direction. For a Morning Star, this is a green candle that recovers at least half of the first red candle’s losses. For an Evening Star, it is a red candle that wipes out at least half of the first green candle’s gains.
How traders usually apply it
Practical application depends on confluence—the idea that a pattern is stronger when it happens near other important chart features.
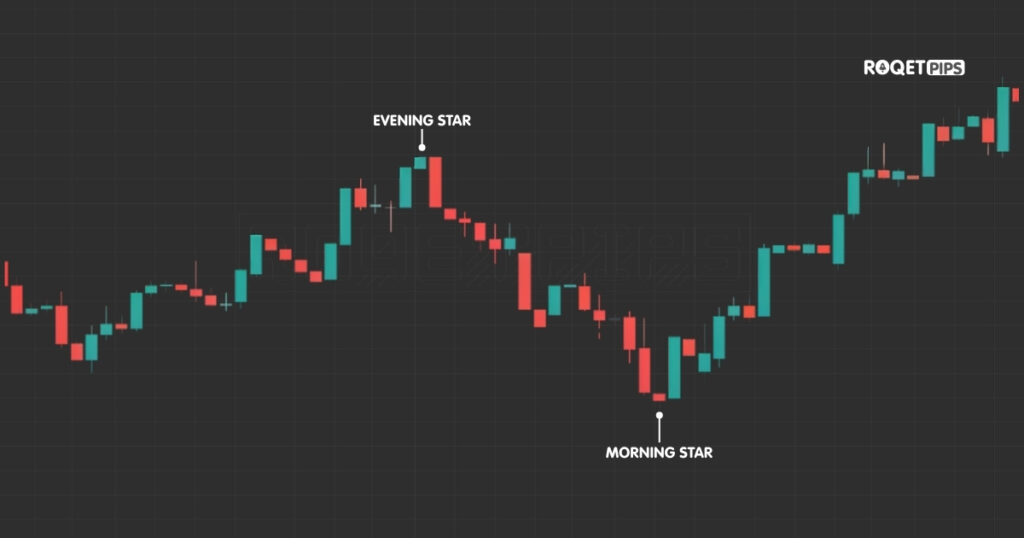
Traders often look for a Morning Star forming exactly at a previous “Support” level (a floor where price has bounced before). Similarly, an Evening Star is much more significant if it hits a “Resistance” level (a ceiling price has struggled to break).
Volume also plays a role. Observation often shows high volume on the first candle (panic or greed), lower volume on the star (uncertainty), and a surge in volume on the third candle (conviction in the new direction). If the third candle has very low volume, the “reversal” might lack the fuel to actually move price higher or lower.
[ADS]
Where it often gets misused or misunderstood
The most common mistake is ignoring the context. A Morning Star pattern that appears in the middle of a sideways, choppy market is usually meaningless. It is only a reversal pattern if there is a trend to reverse. Without a clear move preceding it, the three-candle cluster is often just random price fluctuation.
Another misunderstanding involves the “Star” candle itself. In traditional stock markets, the star often “gaps” away from the first candle (meaning the market closed at one price and opened the next day at a different price). In 24/7 markets like crypto, these gaps are rare. Traders often wait for the gaps that never come, missing the signal. On a continuous chart, the star simply needs to have a small body relative to the candles around it.
Finally, traders often fail to wait for the close of the third candle. It is tempting to enter a trade as soon as the third candle starts moving in the opposite direction. However, if that candle ends up shrinking before it closes, the pattern fails. The “Star” patterns are only complete—and therefore only “real”—once that third candle has finished its time period and closed deep within the territory of the first.
Category: Market Structure
Tags: candlesticks, reversal patterns, price action, trend behavior, market psychology, volatility, indicators
Leave a Reply